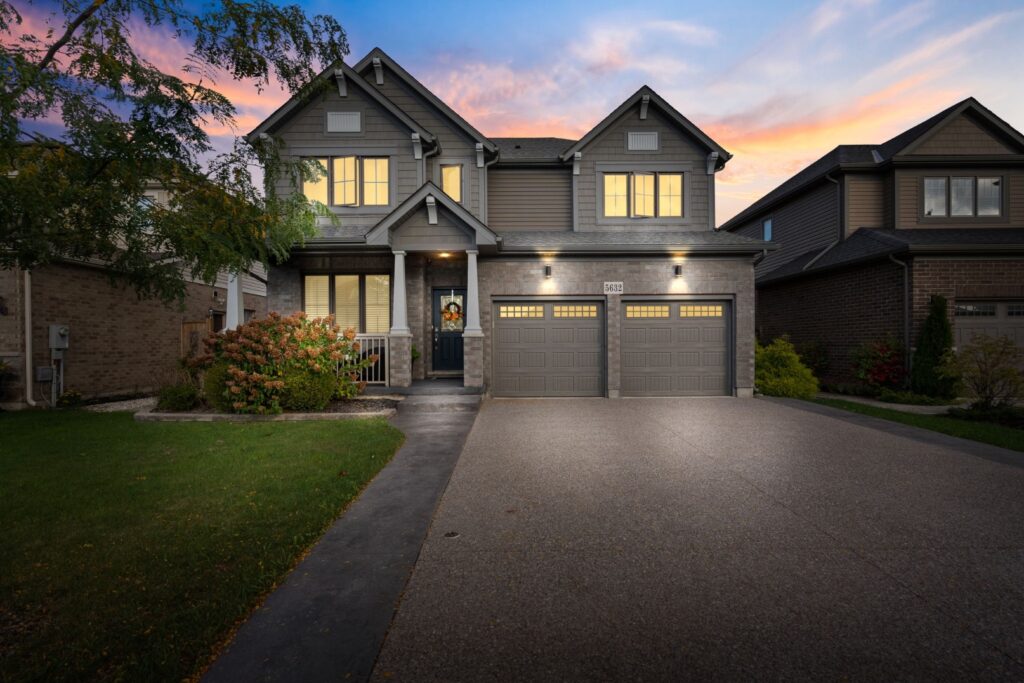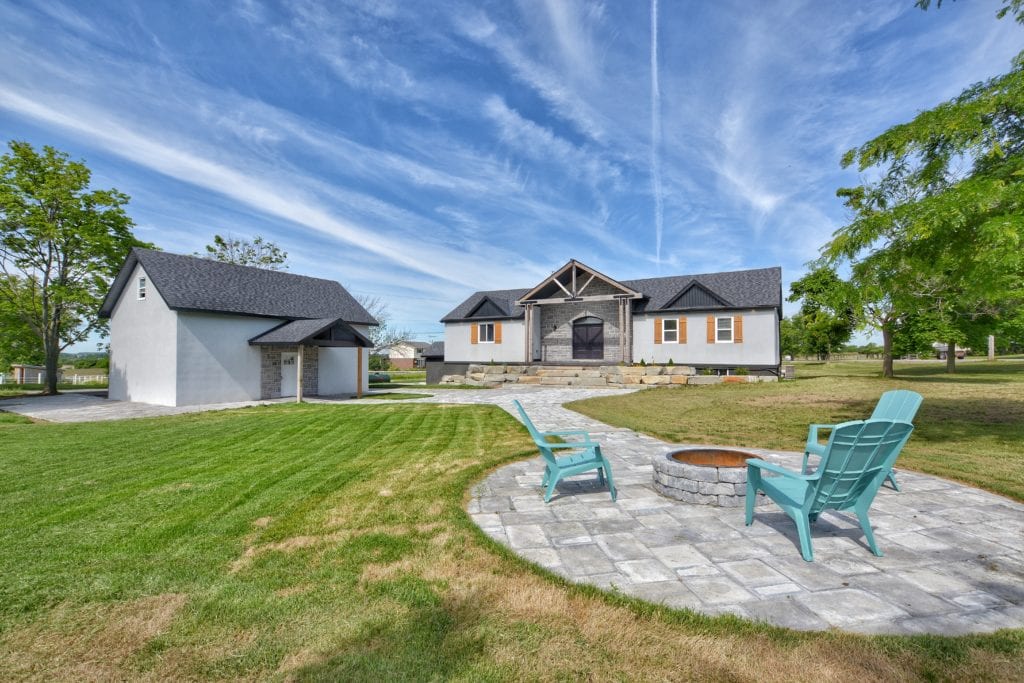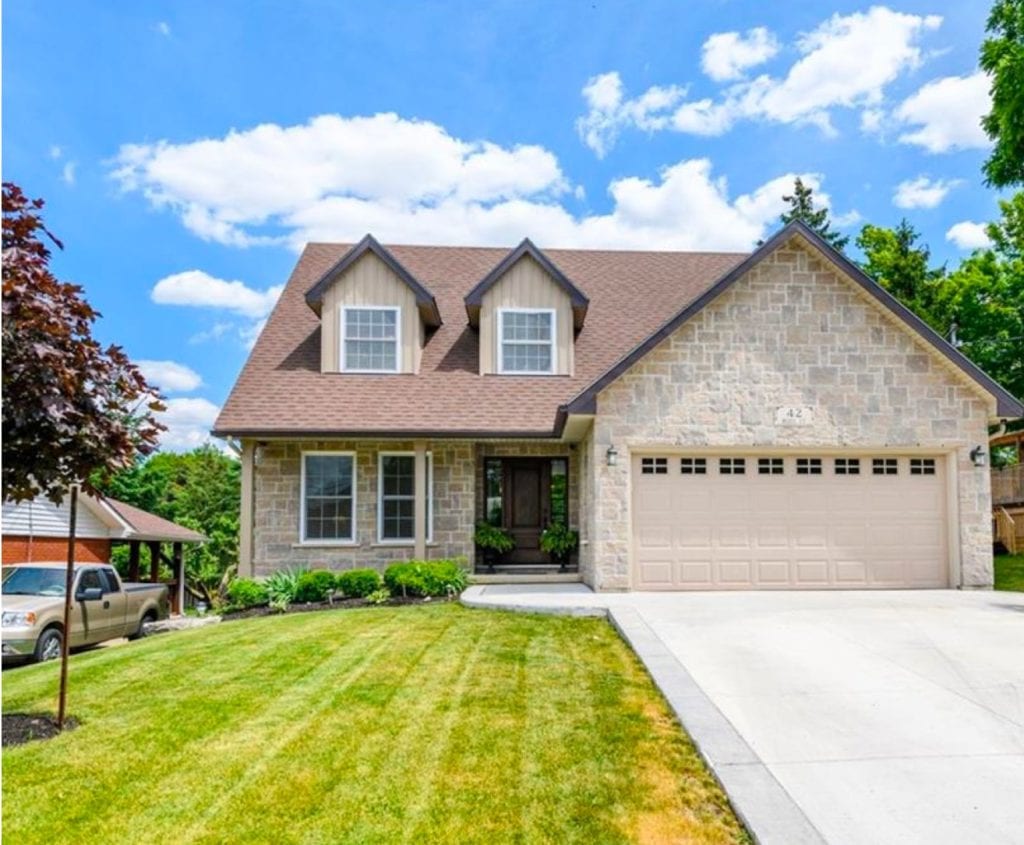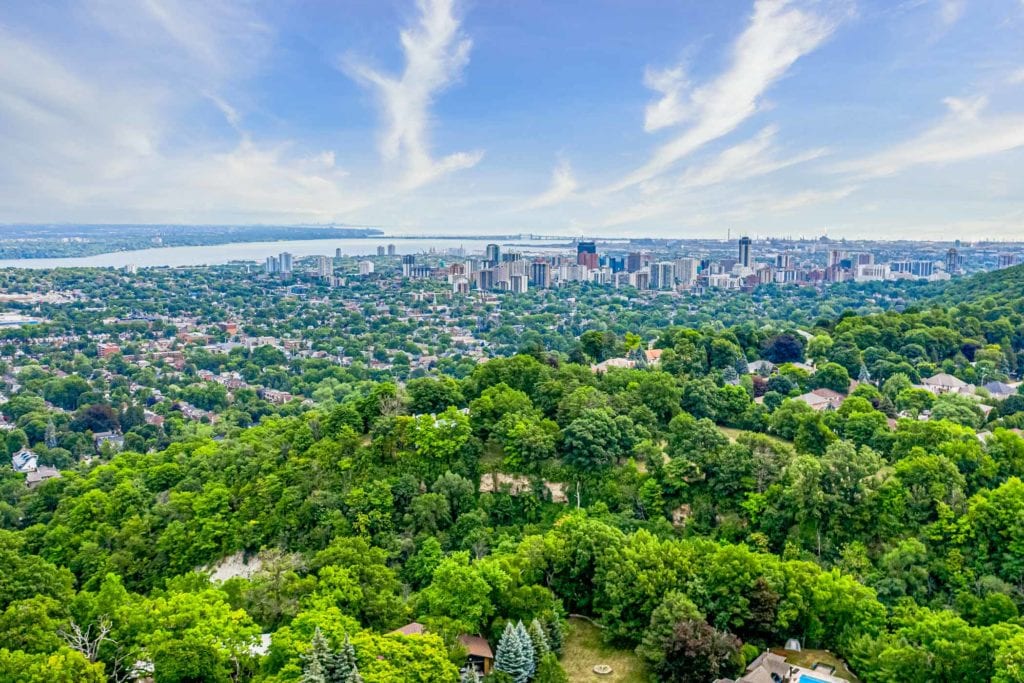
The real estate rush in Hamilton-Burlington continued throughout July and has made its way into August as well!
July was a record-breaking month for our team and a busy time for the market as a whole: Sales were up significantly, prices climbed, and activity surpassed pre-COVID levels!
Here’s a closer look at what happened in July:
Hamilton Market Activity
| Variable | 2020 | 2019 | Difference |
|---|---|---|---|
| Sales Activity | 1,026 | 819 | 25% |
| Dollar Volume | $645,183,379 | $449,419,457 | 44% |
| New Listings | 1,226 | 1,156 | 6% |
| Active Listings | 975 | 1,256 | -22% |
| Months of Inventory | 1.0 | 1.5 | -0.6 |
| Average Price | $628,834 | $548,742 | 15% |
| Median Price | $590,000 | $504,000 | 17% |
| Median Days on Market | 11.0 | 19.0 | -8.0 |
| Average Days on Market | 20.1 | 29.3 | -9.1 |
Burlington Market Activity
| Variable | 2020 | 2019 | Difference |
|---|---|---|---|
| Sales Activity | 394 | 287 | 37% |
| Dollar Volume | $349,391,999 | $220,928,034 | 58% |
| New Listings | 491 | 367 | 34% |
| Active Listings | 340 | 428 | -21% |
| Months of Inventory | 0.9 | 1.5 | -0.6 |
| Average Price | $886,782 | $769,784 | 15% |
| Median Price | $797,500 | $700,000 | 14% |
| Median Days on Market | 10.0 | 19.0 | -9.0 |
| Average Days on Market | 17.0 | 28.0 | -10.9 |
Sales Activity
Sales activity in July not only exceeded June’s record but also that of any typical summer market.
The RAHB reported 1,613 residential property sales for the month, up 23.7% from June and up 27.8% from July 2019.
Driving factors behind this increase include historically low interest rates as well as pent-up demand from buyers, which helped many homes sell quickly and for well over asking.
New Listings
Hamilton’s new listings were up 6% compared to July 2019, whereas Burlington saw a year-over-year increase of 34%.
As the province entered into the next stage of reopening, sellers became more confident and comfortable with putting their homes on the market.
Active Listings
The number of active listings fell in both Hamilton and Burlington in July. Hamilton saw a 22% decline year-over-year and Burlington’s active listings fell 21%.
Months of Inventory
July brought with it another drop in months of inventory for Hamilton and Burlington.
Hamilton now sits at 1.0 months of inventory (down from 1.2 in June) and Burlington has 0.9 months of inventory (down from 1.1 in June).
Average Days on Market
Homes across the area continued to sell with rapid speed in July.
In Hamilton, listings spent an average of 20.1 days on the market, down from 21.6 in June. Burlington also saw a month-over-month dip from 18.8 to 17 days.
Average Prices
In July, the average price for a residential property in the Hamilton-Burlington region rose to $692,999, taking us up 2.6% from June. That’s a 16.3% increase from July 2019.
In Hamilton, this amounted to the average home price increasing 15%, year-over-year, to $628,834.
Home prices in Burlington also saw a 15% year-over-year increase, bringing the average to $886,782.
A Look at What’s to Come
From what we’ve experienced, any lull in the market due to the pandemic is officially over.
We’ve seen record-breaking sales numbers, especially for a summer market, and expect this to continue as we enter into the traditionally busy fall market.
Whether sellers are moving up to accommodate their new work from home lifestyle or relocating out of the city entirely, they’re seeing swift and profitable returns on their investments.
In this market, expert advice makes all the difference. If you have a question about buying or selling your home, call us at 1-844-484-SOLD or email us here.
